Visualising the Persistence Network
Duration
Jan 2024 – Mar 2024
Services
Dashboard UX Design, Data Visualization, Web UI
Role
Product Designer, UX/UI & Visual Systems
Team
Design Lead, Junior Designer & Backend Developer
The Persistence network needed a dedicated Stats Page to make network performance, activity and ecosystem health easier to understand. I designed a modular dashboard that brought key metrics into a single interface for delegators, validators, investors and developers.

THE CHALLENGE
As the Persistence ecosystem grew, network data was spread across different sources and there was no single interface for understanding the health and trajectory of the network.
The goal was to create a dedicated Stats Page that could surface important network metrics while remaining clear, performant and scalable as new data became available.
The dashboard needed to bring together information around staking, liquidity, IBC activity, user activity and validator health without overwhelming users with raw data.
The challenge was not simply to display more metrics, but to establish a clear hierarchy that made the information useful at a glance while still allowing users to explore the details.

DESIGN APPROACH
I started by defining the types of information the dashboard needed to support and how those metrics could be grouped into a scalable system.
UX Goals
Create a modular structure that could accommodate new metrics over time.
Surface important network indicators without creating unnecessary complexity.
Establish clear hierarchy between high-level metrics and detailed data.
Make charts and visualisations easier to interpret.
Provide contextual controls where users needed to change the data view.
Build trust through clear data attribution and real-time update cues.
Metric Mapping & Prioritisation
The dashboard was organised around several key areas of the Persistence network:

Information Architecture
The dashboard was organized into self-contained metric modules, each mapped to a specific user need, from chain-level overview and liquidity tracking to validator health.

Defining this structure early helped reduce visual noise, prioritize content, and leave room for future additions.
DESIGN EXPLORATION
With the information architecture and metric priorities established, I translated the structure into interactive wireframes.
The main challenge was surfacing a high volume of technical data while keeping cognitive load low. I explored different dashboard card structures, spacing systems, graph containers, and information hierarchies before moving toward the final system.
Wireframes
01 - Exploring structure and data visualization
The first draft tested layout groupings, value hierarchy, and visual formats for key metrics such as liquidity, wallet distribution, and performance over time.

02 - Refining structure & metrics
The second draft introduced additional metrics and finalized the visualization formats, with a focus on clarity, completeness, and usability.

FINAL DESIGN
The final dashboard was built around a modular system that allowed complex network data to remain structured, scannable, and adaptable across screen sizes.
Modular Card System
Each major KPI, including TVL, staking ratio, IBC volume, and PCOL funds, was presented as a self-contained card.
This allowed individual metrics to scale across screen sizes without disrupting the overall layout and made it easier to introduce additional data in the future.

Time-Based Chart Filters
Metric cards included filters for 24H, 7D, 30D, and 1Y, allowing users to explore trends across different timeframes. This was particularly useful for analyzing market volatility and validator behavior.

Wallet Distribution
Stacked bar charts segmented wallets into balance brackets such as <10, <100, <1k, and <100k XPRT.
This made token distribution and concentration easier to understand and helped the community and ecosystem partners assess potential concentration risks.
The legend used size-based gradients and distinct colour coding so users could interpret wallet tiers without relying on hover states or tooltips.

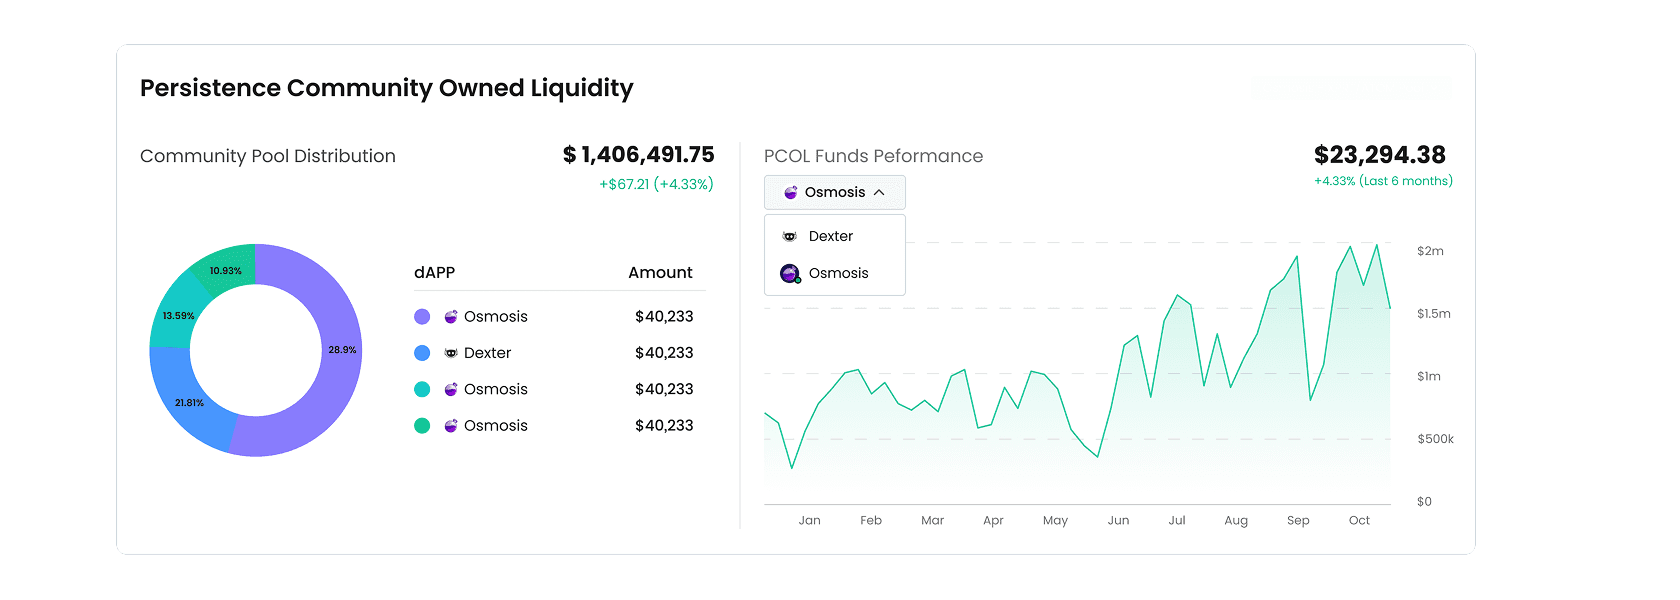
Protocol-Owned Liquidity
PCOL data was divided between DEX and CEX holdings and represented through pie charts and trend graphs.
This helped communicate the strength of community-owned liquidity and how treasury allocations changed over time.
WHAT WE CHOSE NOT TO DO
A fully customizable dashboard
Full customization would have introduced additional state-management complexity and delayed the launch. Instead, we prioritized a curated default experience that served the majority of delegators and validators without requiring setup.
New-user onboarding first
Although onboarding could have made the dashboard more accessible to beginners, V1 was primarily intended for existing stakeholders familiar with staking. The initial focus was therefore clarity and speed for that audience, with broader onboarding left for a later stage.
IMPACT & LEARNINGS
The new Stats Page gave the Persistence ecosystem a dedicated source of truth for network performance, transparency, and ongoing data visibility.
The modular approach also created a scalable foundation for introducing new metrics without redesigning the dashboard structure.
Results
Launched within 2 months
Reduced design and development turnaround for new data cards by approximately 40%
Improved at-a-glance comprehension of wallet distribution, particularly for first-time analysts
Created a more transparent, data-driven view of the Persistence network for delegators, validators, investors, and ecosystem stakeholders
The project reinforced the value of designing the underlying information system before refining the visual interface. For a data-heavy product, the quality of the hierarchy and modular structure ultimately determines how approachable the final interface feels.

